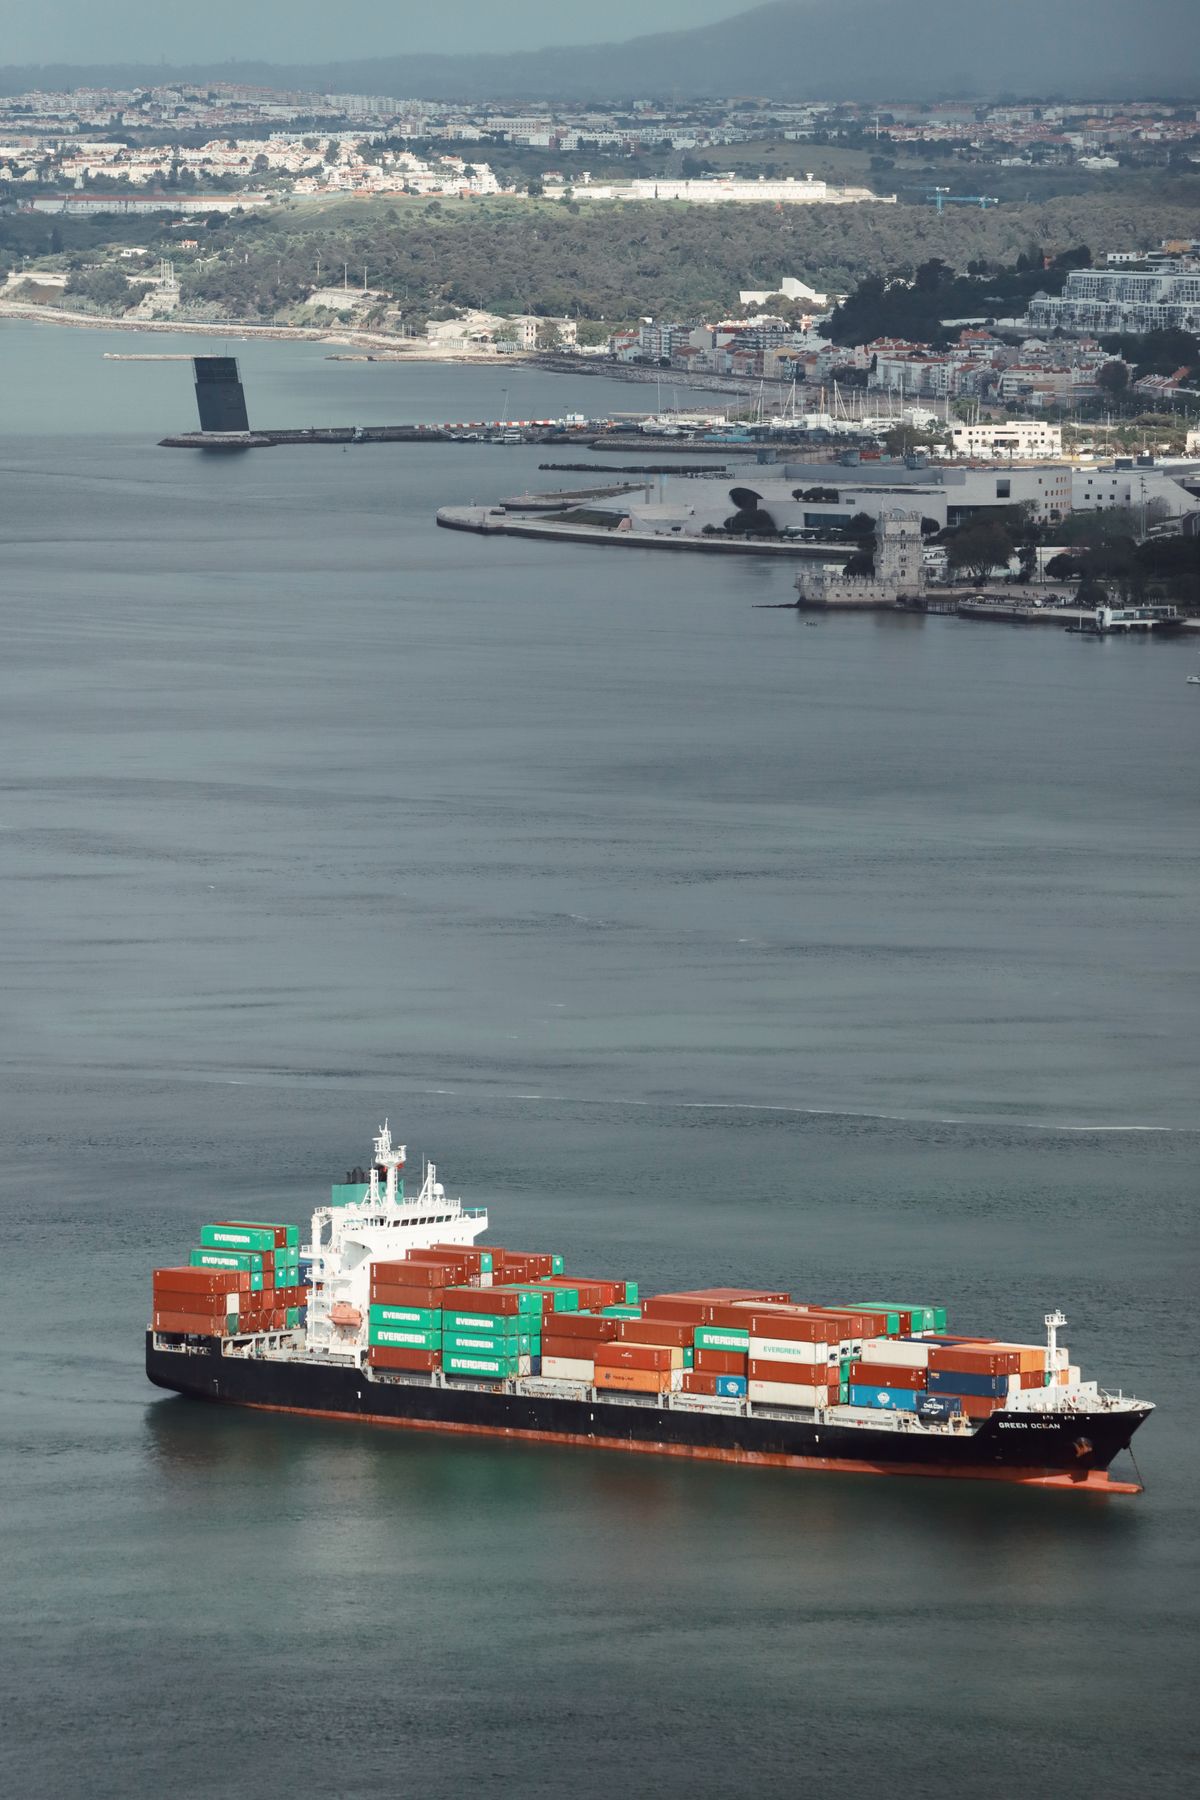
Oil Tanker Tracker: How to Read Routes, Queues and Port Calls Without Overreading the Dots
Every week a new headline claims that a fleet of tankers has vanished from the map, rerouted around a chokepoint or switched off its transponder. Analysts who follow energy markets know that those headlines are only useful if you can read the underlying data properly. An oil tanker tracker such as the one offered by GeoMoney Intelligence Platform puts vessel positions, routes and port calls on one screen, and this guide explains how to read that information without drawing conclusions the data cannot support.
The advice is written for energy analysts, commodity traders, risk managers and journalists who use ship tracking as one input among several. It is a reading guide rather than a trading recommendation.

What a Tanker Tracker Actually Shows
A tracker plots vessels using signals that ships broadcast to identify themselves and report position, speed and heading. Those signals are picked up by coastal stations and satellites, and the tracker draws each vessel as a moving dot with a track behind it. From the dots you can see where a tanker is, how fast it is moving, where it has recently been and which port it appears to be heading toward.
What the tracker does not show is just as important. It does not tell you what is in the tanks, who owns the cargo or whether a sale has been agreed. A vessel type of crude tanker suggests oil, but it does not prove it, and draught readings, which hint at how heavily laden a ship is, are entered by the crew and can be out of date. Treat every dot as a lead to check rather than a fact to quote.
Coverage also varies. Busy coastal waters have dense receiver networks, while remote ocean stretches rely on satellites that refresh less often. Gaps in a track therefore do not always mean something suspicious has happened. They may simply reflect a quiet patch of coverage, so look at the pattern before reaching for explanations.
Reading Routes, Waiting Times and Port Calls
The most valuable information in a tracker is rarely a single position. It is the pattern across many vessels over days and weeks. Count how many tankers are heading to a particular terminal, how long they wait at anchor before berthing and whether the average waiting time is rising or falling. A queue that grows steadily can signal congestion, maintenance or demand changes, while a sudden thinning of arrivals may point to weather or a disruption upstream.
Look at the route as well as the destination. A long detour around a chokepoint adds days to a voyage and changes the effective supply arriving at a port. Compare the current routing with earlier months to see whether a shift is new. Remember that the destination field is typed in by the crew, and it often says something vague or changes late in the voyage, so confirm it against the actual track.
Speed offers another clue. A tanker that slows far below its normal service speed for several days may be waiting for a berth, saving fuel or avoiding a storm. Several ships doing the same thing in one region is more informative than one slow vessel. To understand how a monitor handles one of the busiest chokepoints, this guide on reading a Strait of Hormuz ship tracker without overreading the dots walks through the common traps.
Linking Ship Data to Markets Without Overreach
Ship movements matter because they connect to supply, demand and price, but the connection is rarely instant. Cargo takes weeks to cross an ocean, and the price you see on screen reflects many factors beyond one vessel. A prudent analyst uses tracking to confirm or challenge a story rather than to build a forecast from scratch.
A practical routine is to keep a weekly log. Record the number of tankers heading for key terminals, the average waiting time and any unusual route changes, and compare it with the previous four weeks. Note which signals changed and which did not. After a few weeks the log shows what normal looks like, and departures from normal become obvious.
Combine the log with other sources: official export statistics, inventory data, refinery runs and freight rates. If tracking shows a dip in loadings, check whether inventories confirm it. When several independent sources point the same way, confidence rises. When only one source disagrees, treat it as a question to investigate.
It also helps to separate observation from interpretation in your notes. Write down what you saw, such as the count of tankers and the change in waiting time, in one column, and what you think it means in another. When you review later, you will know which interpretations were right and learn which patterns deserve more weight. The same discipline applies to other commodities, and a broader look at how commodity moves are tracked can be found in this note on how a geopolitical risk intelligence platform helps investors read the market.
Context from the wider risk picture helps as well. Tanker flows rarely move in isolation, and sanctions, conflict and insurance costs all shape which routes ships choose. A morning briefing that pairs vessel data with a map of current events makes patterns easier to interpret, and this thirty-minute geopolitical risk analysis routine shows one way to organise that work without drowning in alerts.
Common Mistakes and a Short Checklist
The first mistake is certainty. A dark patch on the map is not proof of anything, and a single image of a clustered fleet does not establish a trend. The second is ignoring scale: a dozen vessels sounds dramatic until you compare it with the thousands that move each month. The third is forgetting time lags, assuming that what you see today will affect prices tomorrow.
Another common error is relying on screenshots shared on social media. They lack context, often come without dates and may be selectively cropped. Always open the live tool, check the timestamp and look at the history before forming a view. If a claim cannot be reproduced in the tracker, treat it with caution.
Keep a record of your own mistakes too. When a reading turns out to be wrong, write down why, whether the cause was a coverage gap, an outdated draught entry or an assumption about destination, because the same error tends to repeat until you name it. A short list of lessons, reviewed monthly, quietly improves the quality of every later note.
Use a simple checklist. Confirm the vessel type and size. Check the track history for at least a week. Compare the declared destination with the actual heading. Look at other vessels in the same area to see whether the pattern is shared. Cross-check with an independent source before you write anything down as fact. If the answers disagree, say so plainly in your notes.
Finally, remember that tracking is one input in a wider picture that includes policy, weather and demand. If you follow energy more broadly, resources on uranium price movements and other commodity indicators sit alongside shipping data in a good research routine, and reading them together gives a more balanced view than any single chart.
Read the dots carefully, log what you see and keep your conclusions as modest as the evidence allows. That habit turns a busy map into a reliable research tool and keeps you from repeating the headline of the week.